# NetSFC: Real-Time Interactive Campus WiFi Heatmap and Facility Guidance System
## Final Project Report \- Ubiquitous System Architecture
# 0\. Abstract
**Name of the system:** NetSFC
**Authors:**
- Bao Tian Yi (Bradley) \- [
[email protected]](mailto:
[email protected])
- Ray Kojima (Reito) \- [
[email protected]](mailto:
[email protected])
- Karin Fujita (Karin) \- [
[email protected]](mailto:
[email protected])
**Date:** July 31st, 2026
# 1\. Introduction & Motivation
As university campuses increasingly blend physical space with digital coursework, seamless network access and efficient physical spatial utilization have become critical to student success. At Keio University's Shonan Fujisawa Campus (SFC), academic workflows rely heavily on continuous connectivity for online lectures, collaborative research, and self-study. NetSFC was created to eliminate the guesswork of navigating physical and digital campus environments by providing a real-time, interactive platform that bridges Wi-Fi network performance telemetry with indoor facility details.
## 1.1 Background & SFC Campus Challenges
Large, Spread-Out Campus Layout: Navigating between disparate buildings is time-consuming, making it difficult for students to quickly gauge where open, suitable space is available.
Opaque Facility & Classroom Equipment Details: Information regarding specific room capabilities such as available power outlets, seating types, and audio/visual hardware is often unclear or distributed across disparate systems, leaving users uncertain about where to hold hybrid meetings or group tasks.
Inconsistent Wi-Fi Reliability for Critical Tasks: Poor Wi-Fi reception in various dead zones across campus creates major disruptions for high-bandwidth activities, particularly video conferencing and online examinations.
Lack of a Central Decision-Making Tool: Without a single "source of truth" to evaluate both network quality and space availability, students are forced into trial-and-error searching across campus to find an adequate study location.
## 1.2 Objective of NetSFC
The NetSFC system serves both SFC students and administrative/teaching staff by acting as a centralized, interactive facility and network guidance portal.
Specifically, the system addresses these campus pain points by achieving four key goals:
Centralize Campus & Facility Data: Provide a single source of truth that aggregates classroom equipment details, facility specs, and room availability alongside physical maps.
Visualize Real-Time Wi-Fi Performance: Process network telemetry to map high-throughput and low-latency zones dynamically, helping users find reliable spots for bandwidth-intensive tasks like Zoom classes.
Streamline Study-Spot Selection: Enable students to search and filter study locations based on real-time crowd density, connection quality, and specific facility needs (e.g., power outlets, number of seats).
Support Campus Operations: Give SFC staff data-driven insights into spatial bottlenecks and network dead zones to assist with facility allocation and network infrastructure improvements.
# 2\. System Architecture
## 2.1 Overall Architecture
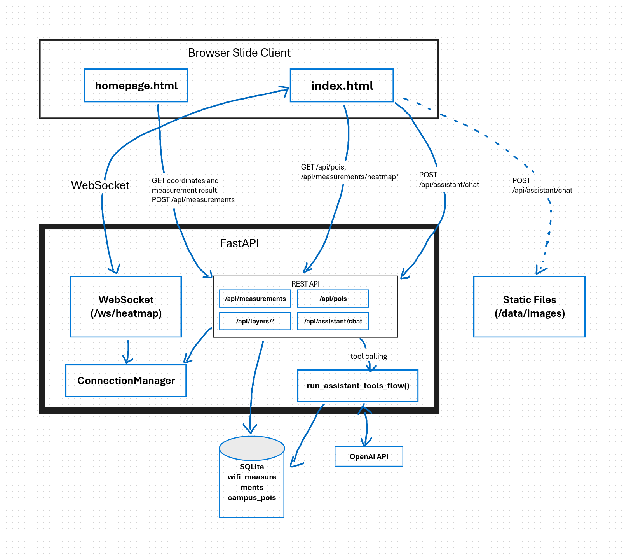
- Frontend / Backend separated: static files under frontend/src can be hosted by any hosting server, and use window.ENV.API\_HOST to indicate backend server address in frontend/src/config.js.
- Backend uses a single FastAPI process, and REST API, Web Socket, AI Tool are all in one main.py file.
- The database is using a single SQLite file with no connection pool, every request uses sqlite3.connect() / close(), which is a lightweight implementation.
- CORS configures using CORS\_ORIGINS in .env file, and when RUNTIME is DEBUG or not configured, CORS is \* by default.
## 2.2 Directory Structure
```
NetSFC/
├── main.py
├── init_db.py
├── data/
│ ├── facilities.json
│ └── images/
├── frontend/src/
│ ├── homepage.html
│ ├── index.html
│ ├── map_page.js
│ ├── measure_page.js
│ ├── speedtest.js
│ └── config.js
├── test/
├── docs/API.md, docs/DATABASE.md
└── run.sh
```
## 2.3 Tech Stack
| Layer | Technology | Description |
| :---- | :---- | :---- |
| Backend Framework | FastAPI | Based on Starlette \+ Pydantic, providing REST API and WebSocket. |
| ASGI Server | Uvicorn | Uvicorn ASGI server |
| Database | SQLite | No ORM, use sqlite3 from python to connect to SQL |
| Configuration | python-dotenv | Read .env from the project root directory |
| Log | loguru | Launch information, exception log |
| AI | OpenAI Chat Completions API (By default, gpt-4o-mini) | Native HTTP client using Python standard library `urllib.request`. |
| Frontend | Vanilla HTML5 / CSS3 / JavaScript (ES Modules) with no framework no packages | frontend/src/\*.html+\*.js |
| Map Engine | Leaflet.js 1.9.4 | Map uses CartoDB Voyager (no label) |
| Map Rotate | leaflet-rotate 0.2.8 plugin | Fixed rotation at 79 bearing to align the campus grid |
| Heatmap | leaflet.heat 0.2.0 plugin | Canvas Gaussian Kernel Heatmap Rendering |
| RTC | WebSocket (FastAPI Websocket \+ Browser WebSocket API) | Broadcast for newly measured data |
| Static Files | FastAPI StaticFiles mount `/data/images` | Layers, classroom, and facility images. |
## 2.4 Overall System Flow
## 2.5 Data Model and Backend API
### 2.5.1 Database Structure
**wifi\_measurements**: every network measurement will report:
| Segment | Type | Description |
| :---- | :---- | :---- |
| id | INTEGER PK AUTOINCREMENT | |
| timestamp | DATETIME DEFAULT CURRENT\_TIMESTAMP | |
| signal\_strength | INTEGER | Signal strength |
| ping\_ms | REAL | Latency (in ms) |
| bandwidth | REAL DEFAULT 0.0 | Bandwidth (in Mbps) |
| coords | TEXT (JSON \[lat, lng\]) | Measurement coords |
**campus\_pois**: building, classroom, facilities and all the items in the map use a standard format (seed from data/facilities.json is imported, and layer\_type determines types, and polygon describes outlines of the building, etc…)
| Field | Type | Description |
| :---- | :---- | :---- |
| id | INTEGER PK | |
| layer\_type | TEXT | polygon / classroom / other facilities, items |
| name / alias | TEXT | Name and alias (e.g. Kappa building with alias “κ”) |
| building / floor | TEXT | Building / Floor |
| coords | TEXT (JSON) | Item is \[lat, lng\] while polygon is \[\[lat, lng\], …\] |
| floor\_images | TEXT (JSON) | Floor number \-\> image URL mapping |
| details | TEXT (JSON) | Capacity, device list, description, and other information… |
### 2.5.2 REST API
| Method & Path | Purpose |
| :---- | :---- |
| POST /api/measurements | Report a WiFi measurement |
| GET /api/measurements/heatmap | Snapshot of a heatmap: support start\_ts/end\_ts or lookback\_hours, limit |
| GET /api/measurements/heatmap/timeline | History timeline: divide by bucket\_minutes, playback using frames |
| POST /api/measurements/cleanup | Clean history records via retention\_hours |
| GET /api/pois | Return all POIs |
| GET /api/layers/{layerType} | Filter items and return filtered items |
| GET /api/health | Health Check: is the server down? |
| GET /api/speedtest/download | Download bandwidth test (see [3.3.1](#3.3.1-heatmap-data-collection)) |
| POST /api/assistant/chat | AI assistant chat |
| WS /ws/heatmap | Real time heatmap socket |
# 3\. Detailed Design & Implementation
## 3.1 Campus POI & Facility Database Design
To resolve the opacity surrounding classroom equipment and eliminate the trial-and-error approach to finding study spots, NetSFC utilizes a unified relational data model. The schema explicitly pairs static facility characteristics (e.g., room capacities, AV equipment, power outlet availability) with dynamic state variables (e.g., active connection density and network performance metrics) to establish a "single source of truth" for campus POIs (Points of Interest).
## 3.2 Geolocation & Crowdsourced Network Measurement {#3.2-geolocation-&-crowdsourced-network-measurement}
NetSFC measures the user location using the geolocation.getCurrentPosition method from the geolocation API. For the website to measure the user’s location, the website first checks if the browser supports the feature. After doing so, the website asks the user for permission to measure the user's location, which the user can accept or decline. If the user accepts the location measurement, the website checks the user’s location, which will return the 3 values latitude, longitude, and accuracy. The data will then be used to check if the user is in the SFC campus and to mark the user’s location on the map.
NetSFC measures network speed using the two metric latency and bandwidth. The two measurement data is sent to the database using HTTP POST. Then network speed is measured by using the “Run Network Test” on the measurement page of the website, which will be then used as data for the heatmap service. For the generation of the heatmap, the two values latency(ping\_ms) and bandwidth are used alongside the value signal to obtain the value weight. Weight is used as the metric for the generation of the heatmap. The equation for the weight is as follows: 
## 3.3 Real-Time WiFi Heatmap & Rotation Management
### 3.3.1 Heatmap Data Collection {#3.3.1-heatmap-data-collection}
`checkNetwork()` method in frontend `speedtest.js` would first launch a latency test using `measureLatency()` and measure bandwidth using `measureAndSendBandwidth`.
By referring to how fast.com accomplish the bandwidth measurement, we use download timer: request `GET /api/speedtest/download?size_bytes=4000000`, and server side respond with `StreamingResponse` block (64KB / block) to stream random bytes (os.urandom()) and frontend side uses performance.now() and ReadableStream to read time taken to calculate the number of bytes actually received with 10 seconds timeout. After recording, it would use POST /api/measurements to post the data to the server.
The server side calculate the weight from three indexes, referring to the formula in [3.2](#3.2-geolocation-&-crowdsourced-network-measurement):
```py
signal_score = (signal_strength / 5) * 0.3 # Signal Strength weight 30%
ping_score = max(0, 1 - ping_ms / 200) * 0.3 # Latency weight, max 200ms, the lower the better
bandwidth_score = min(bandwidth / 100, 1.0) * 0.4 # Bandwidth weight, max 100 Mbps
# Final Weight
weight = signal_score + ping_score + bandwidth_score
```
### 3.3.2 Frontend Rendering
The heatmap rendering is based on `leaflet.heat` plugin.
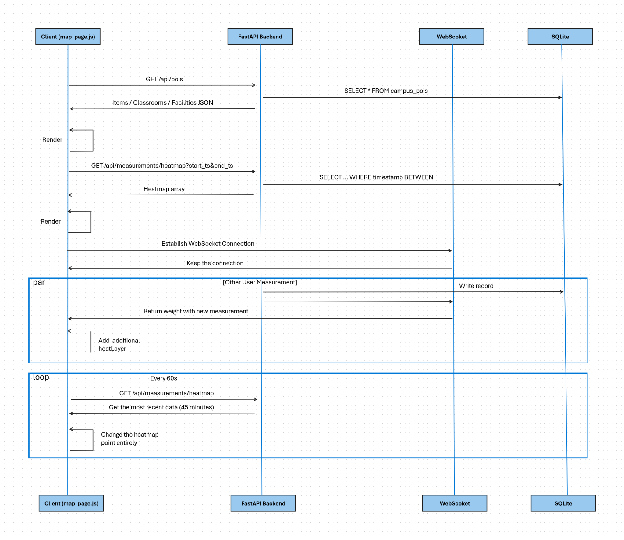
1. Get Snapshot: `loadHeatmapSnapshot()` requests `/api/measurements/heatmap` and use `start_ts` and `end_ts` to specify recent `HEATMAP_LIVE_WINDOW_MINUTES` window. All the history data in the window would be pulled. `renderHeatmapPoints` would replace all heat points as the data is outdated.
2. WebSocket: `connectHeatmapWebSocket` would constantly monitor `/ws/heatmap/` and get the new heat point and push it into `heatPoints`, which is a connection pool (FIFO when reached `HEATMAP_MAX_POINTS`, which is 12,000). It also provides a heartbeat every 25 second ping for automatic reconnection.
The heatmap is turned off by default.
### 3.3.3 History timeline replay
Apart from the “current 45 minutes” view, `/api/measurements/heatmap/timeline` supports dividing an arbitrary time range using `bucket_minutes` (by default 15 minutes) into multiple frames.
- When the heatmap is turned on: it pulls recent 6 hours data `HEATMAP_TIMELINE_LOOKBACK_HOURS`.
- When the timeline is dragged: it shows a specific frame, and stops adding real time measurement heat points.
- Click Live or slide the timeline to the right would trigger “Live”, which would show the real time changes.
- The play button would trigger `toggleTimelinePlayback()` and play with 900ms / frame to replay the WiFi heatmap changes.
### 3.3.4 Map Rotation {#3.3.4-map-rotation}
The SFC campus building complex is not aligned strictly along the cardinal north-south or east-west axes; instead, the entire layout is tilted at a specific azimuth. To ensure the buildings appear "square" on the map—creating a campus plan that aligns better with human visual intuition—the project incorporates the `leaflet-rotate` plugin, fixing the rotation angle upon initialization:
```javascript
map = L.map('map', {
...
rotate: true,
bearing: 79, // Fixed Position
rotateControl: false // Disable user control
});
```
### 3.3.5 Heatmap Rotation
As mentioned in [3.3.4](#3.3.4-map-rotation), the map is rotated. However, `leaflet.heat` plugin does not support rotation, and they are incompatible with each other. In `map_page.js`, we used targeted method overrides to resolve spatial transformation and lifecycle conflicts:
#### Canvas mount location error
`leaflet.heat` plugin hardcoded method `onAdd` and `onRemove` to mount the canvas into `overlayPane`, which completely ignored the `pane` option. The project specifically created `heatmapPane` that does not calculate rotation.
```javascript
const norotateContainer = map.getPane('norotatePane') || map.getContainer();
heatmapPane = map.createPane('heatmapPane', norotateContainer);
```
`norotatePane` is a container that does not provide `rotation` from `leaflet-rotate`, by simply attach the heatmap to it to ensure the Canvas is always rendered "flat," then completely rewrite `heatLayer.onAdd` and `heatLayer.onRemove` to insert the Canvas into this custom \`heatmapPane\` instead.
#### Canvas positioning algorithm error
Leaflet, by default, uses `containerPointToLayerPoint([0,0])` to calculate the layer’s offset relative to the container, but `leaflet-rotate`, in order to make the rotatable layer correctly coordinated, patched this method, which they have it factor in the bearing rotation as well: this is wrong for `heatmapPane`, which they do not rotate. The patch is to avoid using this patched method, and by directly reading the internal method `map._getMapPanePos()` to locate Canvas.
```javascript
heatLayer._reset = function () {
L.DomUtil.setPosition(this._canvas, this._map._getMapPanePos().multiplyBy(-1));
// -- SNIP --
}
```
## 3.4 AI Campus Advisor
### 3.4.1 Tool Calling
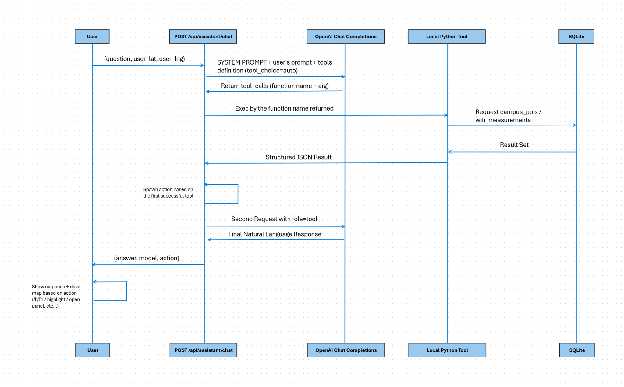
Because AI has a context limitation, the project used an OpenAI function-calling 2 rounds of conversation mode, ensuring that all the coordinates, locations, devices are from a real database, instead of hallucinating.
### 3.4.2 Four local tools
| Tool Function | Purpose | Details |
| :---- | :---- | :---- |
| `tool_find_nearest_poi` | Where is the nearest \_\_\_ facility? | Find similar words defined in `POI_TYPE_SYNONYMS` and classify them in `layer_type`, and use `haversine_distance_m` formula to calculate the distance between user and designated distance. |
| `tool_recommend_wifi_spot` | Which place is suitable for video meetings? | Use the mean value in recent 72 hours in `wifi_measurements` and find the building name by using the same weight formula as defined [3.2](#3.2-geolocation-&-crowdsourced-network-measurement). |
| `tool_get_classroom_details` | What equipment is there in Kappa 11? | Database already has the mapping (for example Kappa \-\> K); First, perform an exact match; next, apply regex normalization using aliases and IDs; finally, use `difflib.get_close_matches` for fuzzy correction and to generate "Did you mean...?" suggestions. |
| `tool_find_facility_by_name` | Where is Lawson? | Perform substring matching on the "Name," "Alias," and "Associated Building" fields; if no match is found, proceed with fuzzy matching. |
### 3.4.3 Action Driven Map
The backend not only return text, but also get an action segment from the first successful tool (`_build_action_from_tool_result`)
- `focus_poi`: locate and highlight a specific facility
- `focus_coords`: Fly to a certain coords
- `open_classroom`: Directly open a classroom detailed panel
- `focus_building`: Fly to the specific building with panel open
- `none`: return only text
### 3.4.4 Communication with OpenAI
Instead of relying on the third party `openai` Python SDK, we use standard library `urllib.request` to POST to https://api.openai.com/v1/chat/completions with temperature 0.2.
## 3.5 Front-end UI/UX & Interactive Panels
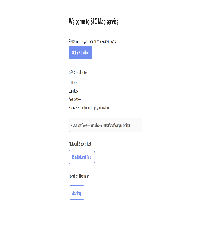
NetSFC is divided into two pages: the map page and the measurement page. The measurement page has 2 main functionalities, which are user location measurement and network speed measurement. These two can be done by pressing the button on the page, which are “Get my location” and “Run Network Test”. After measuring the location, the latitude, longitude, accuracy, and the status is displayed underneath the button. Similarly, the network speed is displayed after clicking the network measurement button. An additional button, “View Map” button is present on the page at the bottom, to move to the map page. The design of the website was done using html and CSS, with the functionality implemented using Javascript with functions defined at section 3.2.
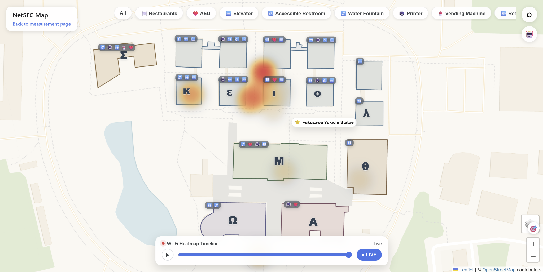
The map page has more functionality, including clickable buildings and items. When the user first loads the map page, the map is centered around the SFC campus, with color coded buildings and item icons at the top of the buildings. Additionally, buttons to filter out items on the campus are available at the top of the map. For example, when the user clicks the button “water fountain”, water fountains will be visible on the map using pins. Other buttons include settings button, zoom button, ChatGPT button, layer button, and user location button. When the user clicks the ChatGPT button, an AI chatbot appears in the right hand side of the screen, giving users opportunities to ask about the SFC campus. A question should be relevant to the SFC campus, such as items or network status. The layer button lets the user turn off the heatmap if necessary. Most functionalities for the map are defined in the file map\_page.js, which is then connected to the map page index.html for design purposes.
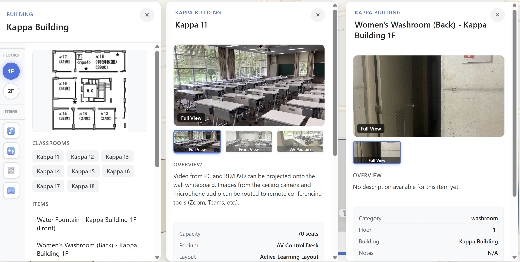
One of the main functionalities of the map is the clickable buildings and items, which displays a panel including relevant information of either the building or an item. When a user clicks on a building, the panel with the label “building” and the name of the building is shown at the top along with the layout image of the building. Underneath the map includes a list of classrooms and items in the building. Both the classrooms and items are clickable. For the classroom, pictures of the classrooms are displayed at the top, with an overview and information about the classroom underneath them. For the item, a picture is also displayed at the top with small information about the item underneath it. The building has multiple tabs which are divided with floors, which can be switched using the button in the left hand side of the panel. The items can also be filtered as well using the item buttons underneath the floors. For the clickable buildings, its data was collected using geojson.io for the coordinates. Other data was collected referencing websites such as the CNS guide and SFC Classroom website.
The other main function, the heatmap uses the weight value as defined in section 3.2. The heatmap is displayed to the users with different color gradation. For locations with better internet speed, the color red is displayed on the map.
# 4\. Deployment
Currently the map is deployed in: [https://ais-official.sfc.keio.ac.jp/map/](https://ais-official.sfc.keio.ac.jp/map/).
## 4.1 Frontend
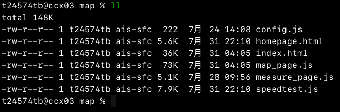
The frontend part of the project is deployed on CNS server (ccx03), a virtual host server managed by Keio University Information Technology Center. A script has been deployed to update the file from Github to get the latest version.
## 4.2 Backend
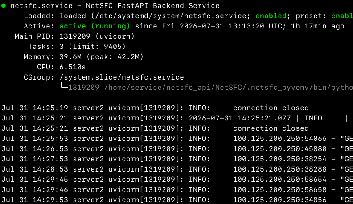
The backend is hosted on server2.tianyi.cloud (covered by overlay network, Ubuntu linux server) under gateway server1.tianyibrad.com with domain [netsfc-api.tianyibrad.com](http://netsfc-api.tianyibrad.com). The process is run by systemd.
# 5\. Team Division of Labor
**Reito Kojima**
- Frontend Design: Panels, measurement page, basic map features
- Functionalities: Network measurement, user location, panels
- Data Collection: Building Coordinates, Building/Classroom images and descriptions
**Karin Fujita**
- Data Collection: Item coordinates
- Photo Collection
- Slideshow Creation
**Bao Tian Yi**
- Backend Architecture: Designed and implemented the asynchronous architecture using FastAPI and SQLite.
- Partial Frontend Design: Classroom panels, item panels, map design optimization.
- Functionalities: Real-Time Heatmap, AI Advisor, Action Driven Map.
- Production Deployment: Deploy the project in a production environment.
# 6\. Discussion
## 6.1 Technical Difficulties and Lessons Learned
**Challenge**: During production testing, submitting speed test measurements via `POST /api/measurements` frequently failed with a misleading “CORS Policy Violation” error on the browser side. Standard CORS headers were properly configured on FastAPI while the error persisted.
**Cause**: The root cause has been identified. The legacy test uploaded a 2MB dummy payload in the POST body. The server side, under nginx reverse proxy, rejected payloads exceeding its 1MB `client_max_body_size` default, returning `413` HTML error. Because Nginx default error page bypasses FastAPI’s CORS middleware, it lacked CORS headers, causing the browser to misinterpret the 413 response as a CORS failure.
**Resolution**: Re-architected speed test method, which mirrored Fast.com, transitioned to a download model for bandwidth estimation, where the server streams 4MB of random bytes. The client records receipt time using `ReadableStream` and subsequent POST telemetry payloads remain minimal in size, avoiding proxy rejections.
## 6.2 Limitations and Future Work
- Some buildings / items still lack images and descriptions
- Building layout images might be outdated
- Heatmap could not determine multi-floors
- Mobile app shall be developed for user to view easily
- Support Kiosk mode
# 7\. Repository Maintenance
The repo has been moved from personal repository ([BradleyBao/NetSFC](https://github.com/BradleyBao/NetSFC)) to organizational repository ([Keio-SFC-AIS/NetSFC](https://github.com/Keio-SFC-AIS/NetSFC)) by transferring the ownership for long-term sustainability, reliability, and ease of deployment under the organization [Keio SFC AIS](https://ais-official.sfc.keio.ac.jp/).